Exposure Management Platform Design
Exposure Management Platform Design
Exposure Management Platform Design
Creating a proof-of-concept for a new age cybersecurity tool to win over investors.
Creating a proof-of-concept for a new age cybersecurity tool to win over investors.
Creating a proof-of-concept for a new age cybersecurity tool to win over investors.
Wireframe
Wireframe
Prototype
Prototype
UX Strategy
UX Strategy
ROLE
ROLE
ROLE
Lead UX Designer
Lead UX Designer
Lead UX Designer
DOMAIN
DOMAIN
DOMAIN
Cyber-security
Cyber-security
Cyber-security
TYPE
TYPE
TYPE
Proof-of-Concept
Proof-of-Concept
Proof-of-Concept
DURATION
DURATION
DURATION
3 Weeks
3 Weeks
3 Weeks
Ophi*, a new and emerging cybersecurity startup, had a tight deadline and big dreams.
They needed a proof-of-concept to validate their bold new approach to exposure management. While traditional systems had a narrow focus, their idea was a lot more holistic and open.
While working under tight deadlines in collaboration with the founding team, we designed a platform that distills complex data into clear and actionable insights. Our POC was received well by their pilot users, which initiated the second, deeper phase of the project.
Design Process.
Design Process.
Design Process.
Understanding the problem space.
Understanding the problem space.
Understanding the problem space.
As someone without any cybersecurity expertise, I faced an immediate challenge: understanding the intricacies of exposure management well enough to design an intuitive experience around it. The task was daunting, but I approached it systematically through key lenses:
The Users - Staying true to the spirit of UX, I approached this by deeply researching the users: CISOs (Chief Information Security Officers) and their teams. By studying their resposibilities and pain points, I understood that the platform needs to enable rapid decision-making, not deep analysis.

Fig 1: Security Team (For representation purposes only)
Fig 1: Security Team (For representation purposes only)
Fig 1: Security Team (For representation purposes only)
The Domain - through extensive secondary research and interviews with the experts at Ophi, I built a working understanding of exposure management:
The Domain - through extensive secondary research and interviews with the experts at Ophi, I built a working understanding of exposure management:
The Domain - through extensive secondary research and interviews with the experts at Ophi, I built a working understanding of exposure management:
Exposure = Potential
If a system is a house, then a cybersecurity attack is like a fire ravaging the house from within. Typically, cybersecurity systems are reactive, like putting that flames out with a fire extinguisher.
Exposure management however, is proactive. It's like identifying a loose wire here, a leaky gas pipe over there - long before the fire can even start - and taking action.
In our, this can look like spotting a compromised password or a weak firewall, well before the cyberattacks start.
Design & Strategic pivots.
Design & Strategic pivots.
Design & Strategic pivots.
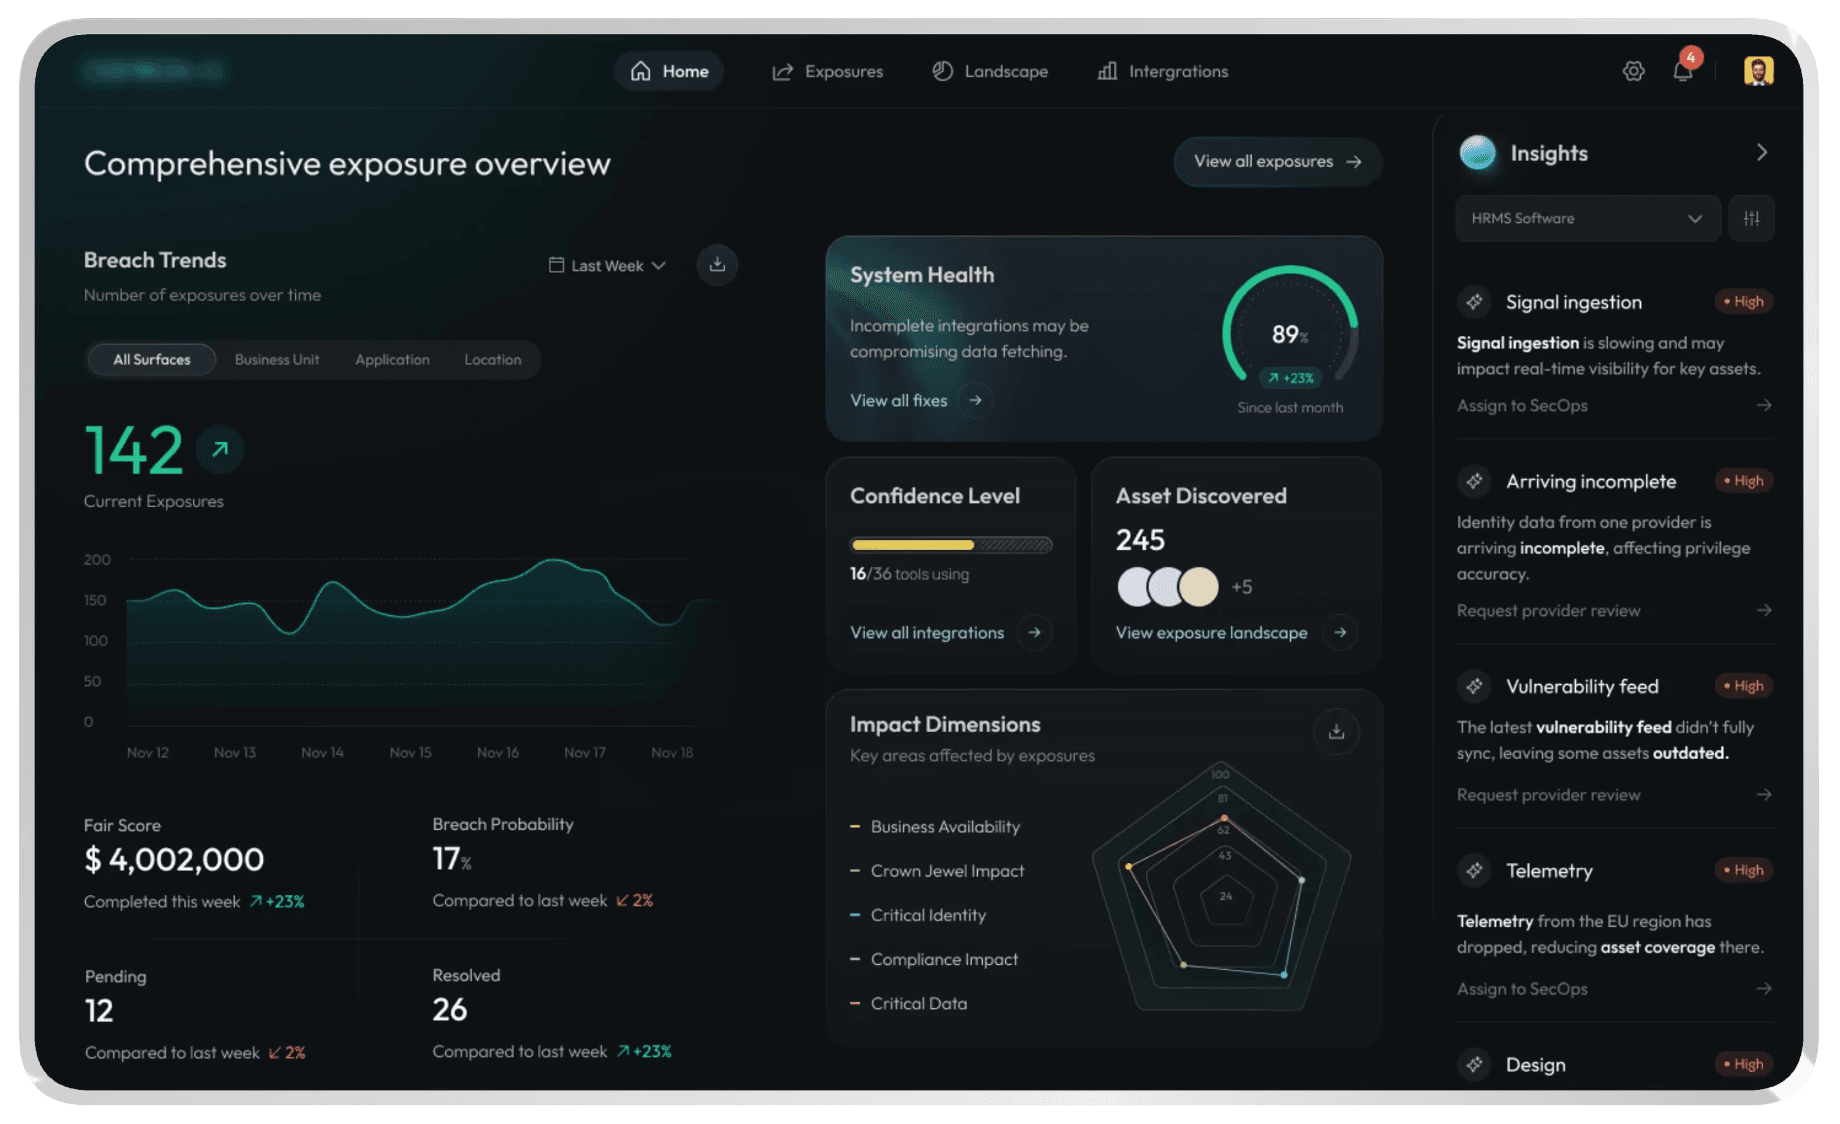
The competitive landscape was already chock-full of platforms that presented endless data in an overwhelming manner.
To set Ophi apart, we went for a much more distilled approach, especially with the dashboard.
Decreasing cognitive overload - By creating floating panels, we were able to maximize the viewport and kept only the relevant tools accessible. We also created a unified console, which was a masssive step up from the earlier version where every tool had it's own labelled action button (Fig 4)
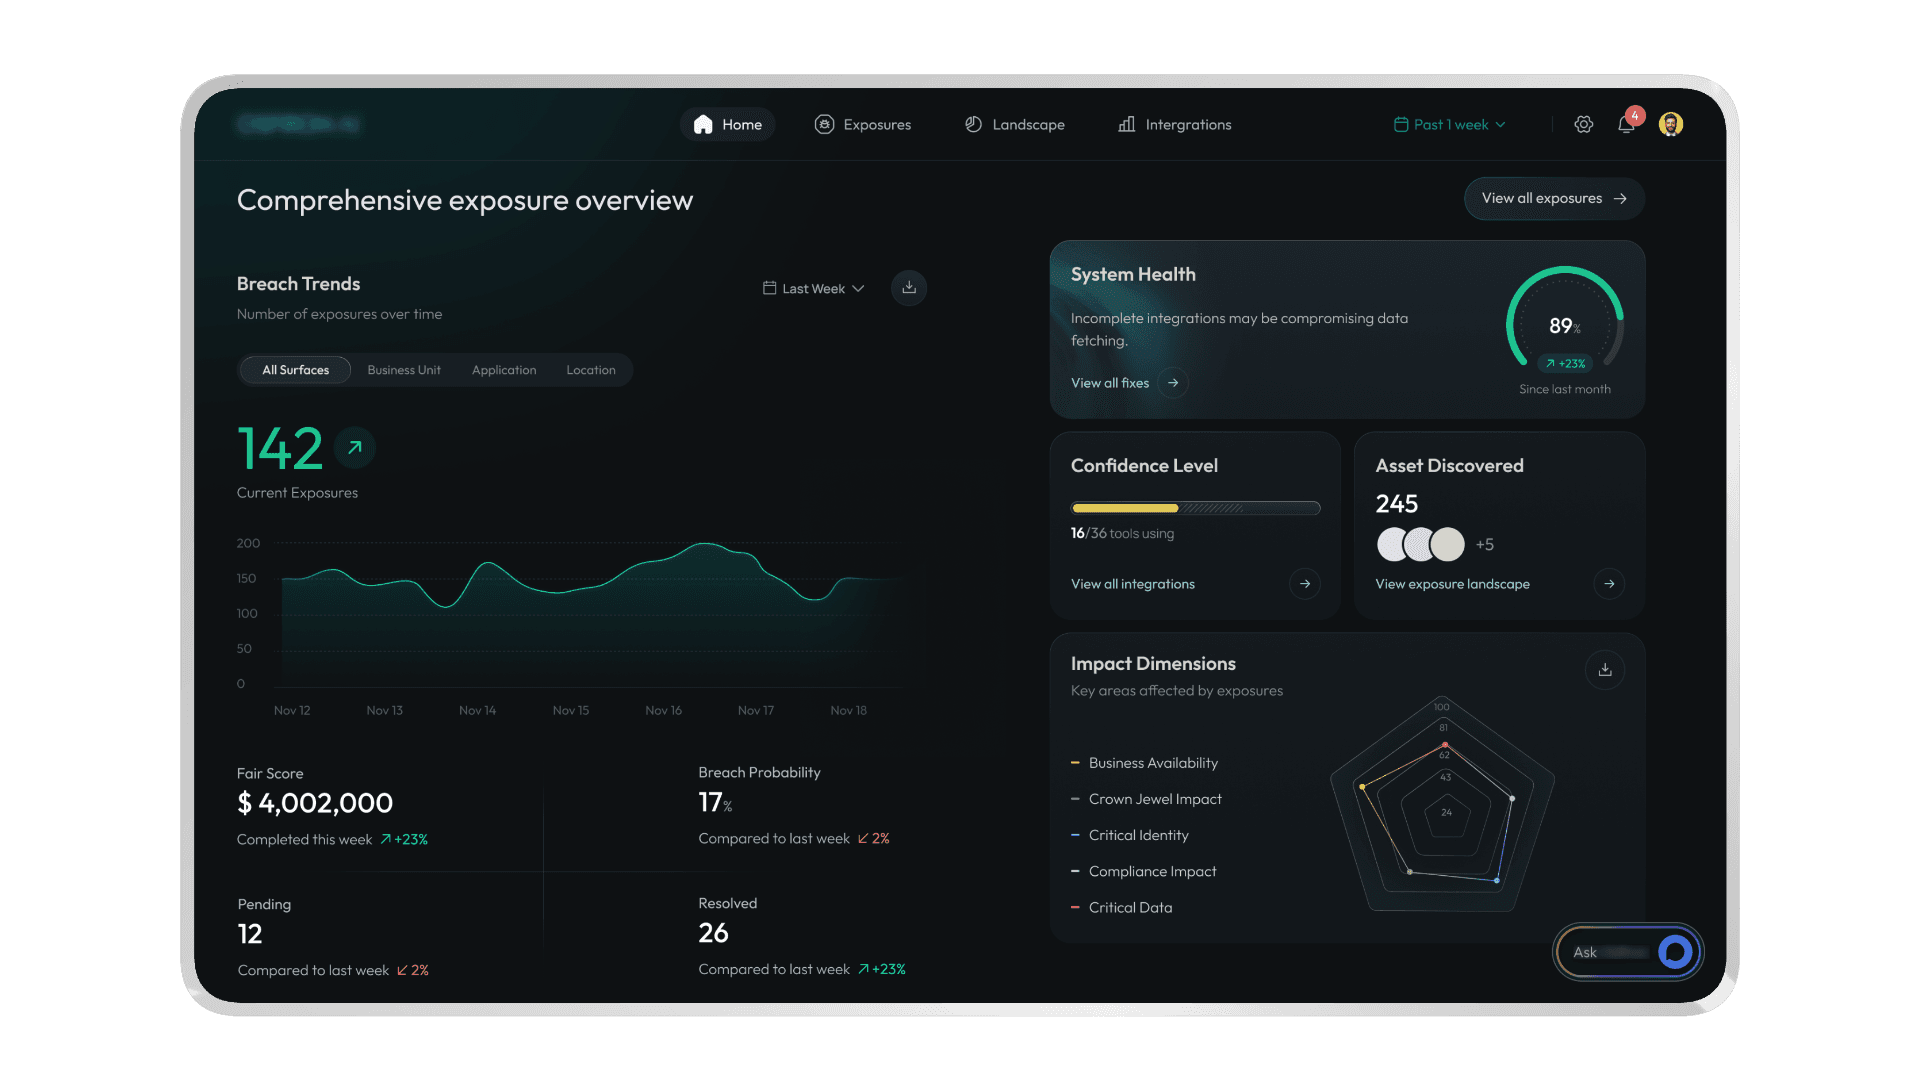
Fig 2: Dashboard design
Fig 2: Dashboard design
Fig 2: Dashboard design
Modular approach - In addition to reducing cognitive overload, we also kept many of the screens modular for two reasons: One, to give the user full control over their view. And two, to ensure that rigid patterns are not set up so early in the design process, considering that this is an evolving product.
Modular approach - In addition to reducing cognitive overload, we also kept many of the screens modular for two reasons: One, to give the user full control over their view. And two, to ensure that rigid patterns are not set up so early in the design process, considering that this is an evolving product.
Modular approach - In addition to reducing cognitive overload, we also kept many of the screens modular for two reasons: One, to give the user full control over their view. And two, to ensure that rigid patterns are not set up so early in the design process, considering that this is an evolving product.
Clear graphical representation.
Clear graphical representation.
Clear graphical representation.
The most challenging design problem, as well as the most critical was the representation of the Exposure Chain - i.e. the story of how isolated events come together to form one urgent exposure.
Every chart I explored initially, from sankey graphs to mind maps, either felt too unrealistic or failed to capture the full story.
After many iterations, I designed a three-part graphical representation inspired by tools like Obsidian and Connected Papers (Academia Website):
Scannable panel - All the signals were now placed as cards within a scrollable list, while the trigger event was sticky at the top.
Interative node graph - A visual and interactive network now occupied the center, helping the user understand the underlying connections.
Drillable pop-ups - Details on each signal was now accessible on pop ups, with further linking to a data repository kept out of the way.
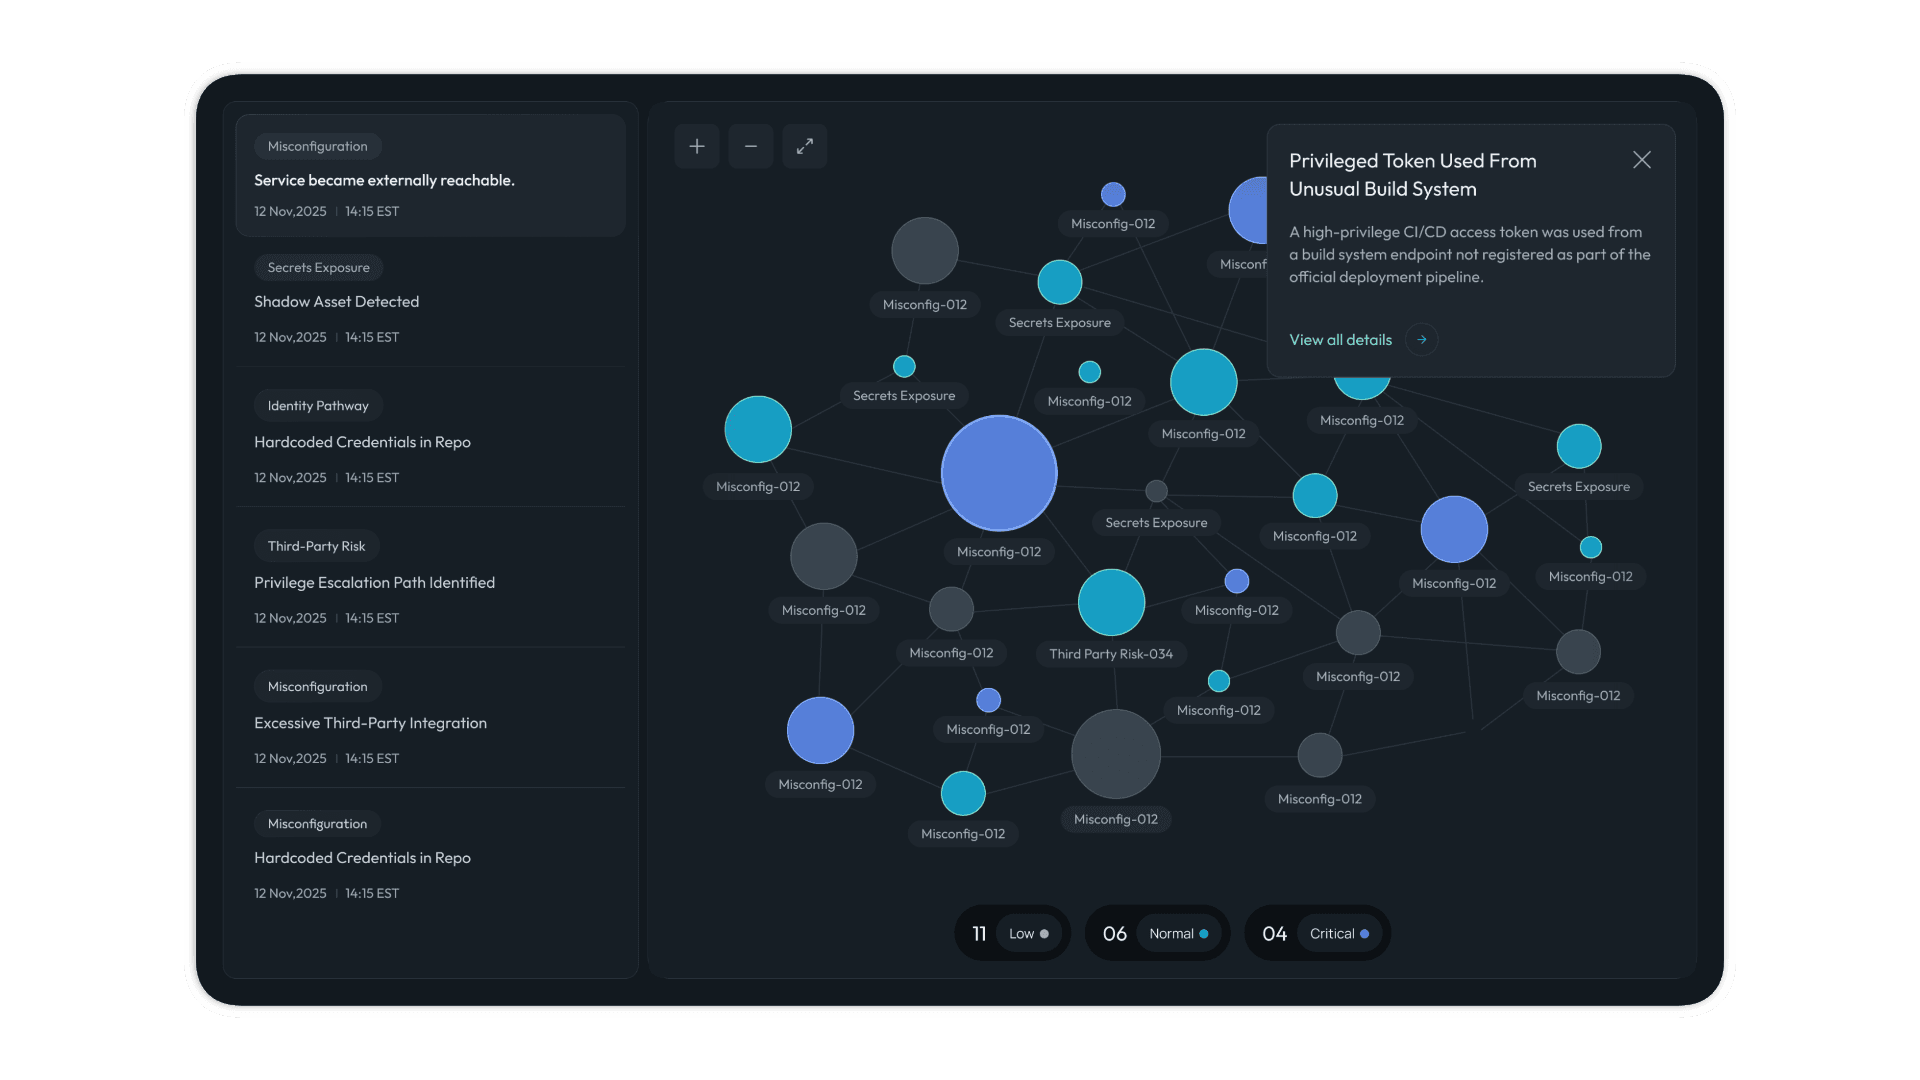
Fig 3: Node-graph
Fig 3: Node-graph
Fig 3: Node-graph
Outcomes.
Outcomes.
Outcomes.
At the end of our rapid sprints, we were able to successfully:
Deliver a concentrated and effective flow in a visually appealing packing.
Have the concept validated by pilot users within the first demo rounds, leading to the advancement of the project to the second phase.
At the end of our rapid sprints, we were able to successfully:
Deliver a concentrated and effective flow in a visually appealing packing.
Have the concept validated by pilot users within the first demo rounds, leading to the advancement of the project to the second phase.
At the end of our rapid sprints, we were able to successfully:
Deliver a concentrated and effective flow in a visually appealing packing.
Have the concept validated by pilot users within the first demo rounds, leading to the advancement of the project to the second phase.
Reflections.
Reflections.
Reflections.
This project helped equip me with extra tools and tricks for processing large batches of literature. It also helped me deepen my secondary research process even further.
On a more personal note, it taught me that I am capable even faster as a designer than I thought.
This project helped equip me with extra tools and tricks for processing large batches of literature. It also helped me deepen my secondary research process even further.
On a more personal note, it taught me that I am capable even faster as a designer than I thought.
This project helped equip me with extra tools and tricks for processing large batches of literature. It also helped me deepen my secondary research process even further.
On a more personal note, it taught me that I am capable even faster as a designer than I thought.
Get in touch with me for opportunities, consultations or even just a chat
ALL RIGHTS RESERVED. ANJANA ELANGOVAN 2025

Get in touch with me for opportunities, consultations or even just a chat
ALL RIGHTS RESERVED. ANJANA ELANGOVAN 2025
Get in touch with me for opportunities, consultations or even just a chat
ALL RIGHTS RESERVED. ANJANA ELANGOVAN 2025